SEO Analysis for JavaScript: Auditing and Ranking Modern Web Apps

If you've ever watched a beautifully built React or Next.js site struggle to rank while a plain HTML page from 2015 outperforms it, you already know the problem. SEO analysis for javascript, I've seen this exact scenario play out on a SaaS client whose Next.js marketing site was getting less than 200 organic clicks per month despite having genuinely useful content. Their competitor, running a WordPress blog with no technical sophistication, was pulling 8,000 clicks on the same topics. The difference wasn't content quality. It was SEO analysis for JavaScript done wrong, or more accurately, never done at all and this is exactly where a proper react SEO guide becomes essential.
JavaScript-heavy sites have a complicated relationship with search engines, and standard SEO tools often miss the nuance entirely. In this guide, I'll walk you through everything you need to know about SEO analysis for JavaScript sites, from rendering pipelines and audit tooling to LLM-powered analysis, Google Search Console data integration, and building a real dashboard that ties all of it together.
Whether you're running an international SEO audit, investigating a full site analysis for a client, or trying to understand why your search engine rank reporting looks flat despite solid content, this is the guide for you.
Why JavaScript SEO Analysis Is Different from Everything Else
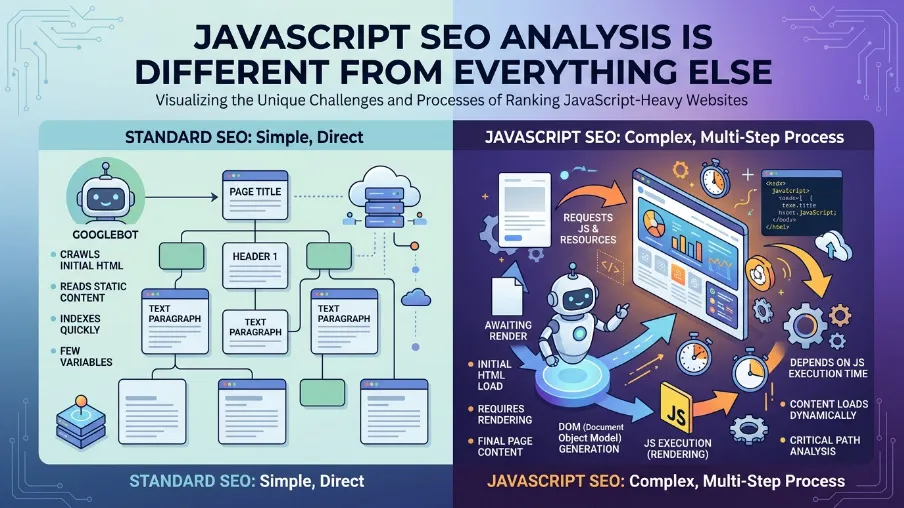
Traditional SEO assumes your HTML is static. What Googlebot fetches is what gets indexed. With JavaScript frameworks like React, Vue, Angular, and Svelte, the HTML shell is often a near-empty document that gets populated only after JavaScript executes in the browser. That's the root of most JavaScript SEO problems.
Here's what I see repeatedly in site analysis work: Googlebot crawls a page, sees only a <div id="root"></div>, and indexes nothing meaningful. The page tanks in rankings not because the content is bad, but because it was never really seen by the crawler in the first place.
I ran a site analysis for an e-commerce website where their React storefront had 340 product pages. Google Search Console showed all 340 pages submitted, but only 47 were indexed. The audit revealed that their product descriptions, which were the primary content on each page, were being fetched from an internal API after page load. Googlebot was seeing empty product pages. Six weeks after switching to SSR for those product components, indexed pages jumped to 298 and organic sessions increased by 61%.
That's the kind of result that makes modern SEO worth taking seriously as a discipline, not just a checklist.
The three rendering modes you need to understand
Client-Side Rendering (CSR) means the HTML is empty on first load. JavaScript runs in the browser and populates the DOM afterward. This is risky for SEO unless Googlebot executes your JS correctly, which it does, but with a crawl queue delay that can stretch to days.
Server-Side Rendering (SSR) means the HTML is pre-populated on the server before being sent to the browser. This is best for SEO because Googlebot gets real, indexable content immediately. Next.js, Nuxt, and Remix are the standard choices here.
Static Site Generation (SSG) means the HTML is pre-built at deploy time. This gives you the fastest possible SEO baseline and works well for content that doesn't change per user.
For SEO analysis on JavaScript sites, always check the rendered HTML and not just the page source, using Google's URL Inspection tool or a headless browser. If your rendered and source HTML differ significantly, your SEO analysis is incomplete and any audit results you're reading will be misleading.
Running a JavaScript SEO Audit: What to Actually Check
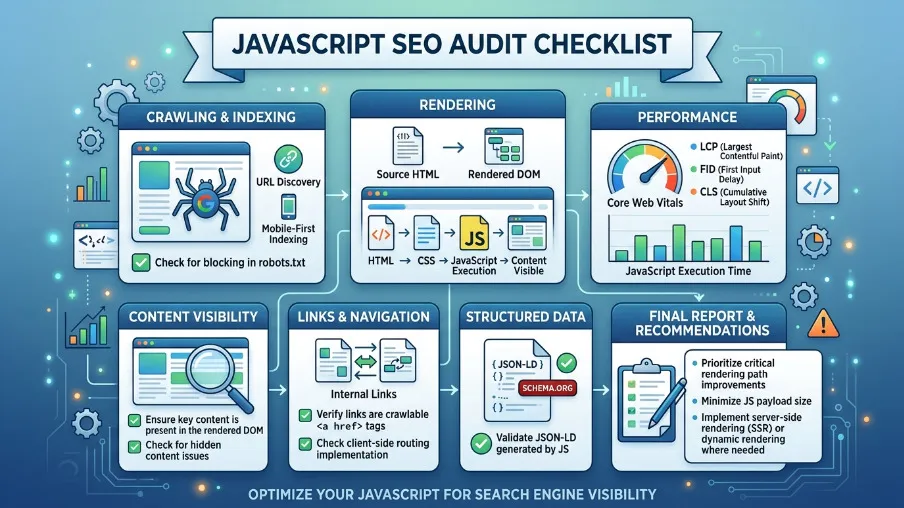
A proper SEO audit for JavaScript goes beyond title tags and meta descriptions. The first time I built out a proper seo competitor analysis checklist for a fintech client, I listed 22 items. By the end of the project, that list had grown to 67 because JavaScript introduces failure modes that simply don't exist in static sites. Here's the baseline I'd recommend for anyone starting out.
Crawlability and rendering
Start by testing your rendered HTML versus your raw source using Google Search Console's URL Inspection tool. Check for JavaScript errors in the browser console that could silently block rendering. Confirm your robots.txt doesn't block the JavaScript or CSS files Googlebot needs to render your pages. Validate that <meta name="robots"> tags are present in the initial HTML payload and not injected by JavaScript after the fact, because Googlebot may not wait for that.
On a recent audit for a travel booking platform, I found that their noindex meta tag was being applied conditionally by a React component that took 800 milliseconds to mount. Googlebot was sometimes reading the page before that component mounted and indexing pages that should have been excluded. That's the kind of subtle rendering race condition that only shows up during a thorough JavaScript site analysis.
Core Web Vitals and performance
Largest Contentful Paint should be under 2.5 seconds. JavaScript hydration often inflates this well beyond that threshold. Cumulative Layout Shift is frequently caused by dynamic content injected by JavaScript, where elements shift around as the page loads. Interaction to Next Paint spikes on slower devices when heavy JS bundles take time to parse and execute.
In my experience, fixing Core Web Vitals on JS-heavy sites typically moves a page's search engine positioning by two to five positions for competitive keywords. That's not a guarantee, but I've seen it consistently enough across projects that I now treat CWV as a first-priority item on every audit of SEO mistakes, rather than a nice-to-have item.
A good search engine positioning example of this: a content site I worked with had a blog ranking at position 14 for their primary keyword with a CLS score of 0.42. After fixing the layout shift caused by a dynamically loaded ad unit, CLS dropped to 0.04, and within six weeks the page moved to position 7. No content changes, no link building. Just rendering hygiene.
Structured data and schema
JSON-LD injected dynamically via JavaScript is generally fine. Google executes the JS and reads the structured data. But dynamically injected schema that depends on API calls, for example fetching a product price before inserting JSON-LD, can be unreliable. For an international seo audit, structured data validation across locales is often where the most damaging issues hide undetected.
One commonly missed issue is injecting hreflang tags via JavaScript. These need to be in the static HTML or your sitemap to be reliable. Dynamic hreflang is one of the most frequently missed items across international SEO audits, and it causes geo-targeting to fail silently.
Open Source SEO Tools Worth Using for JavaScript Sites

The paid tools like Semrush, Ahrefs, and Screaming Frog are excellent, but open source seo tools have matured significantly and are worth knowing deeply. Over the past two years I've shifted a meaningful portion of my audit workflow to open source tooling, partly for cost reasons on smaller client projects and partly because the TypeScript-native options now give me far more control over how I process and report data.
The @power-seo ecosystem is particularly well-suited for JavaScript developers because every package is TypeScript-first, has zero runtime dependencies, and is designed to run in any JavaScript environment including Node.js, Cloudflare Workers, Next.js API routes, and Vercel Edge functions. You can build your entire SEO analysis pipeline within your existing JavaScript toolchain without switching contexts.
The @power-seo/audit package runs a full SEO audit covering meta, content, structure, and performance rules. The @power-seo/analytics package handles the data intelligence layer by merging GSC data with audit results, computing correlations, detecting trends and anomalies, and producing dashboard-ready output. Google Search Console provides your real search performance data directly. Lighthouse handles Core Web Vitals and accessibility scoring. Together these give you a complete open-source SEO stack that I've used on projects ranging from 50-page brochure sites to 40,000-page e-commerce catalogs.
For google places seo work specifically, I layer in the Google Places API alongside @power-seo/analytics to pull location-specific performance data and cross-reference it with audit scores per landing page. A local services business I worked with in late 2024 had 18 city landing pages, each with its own GSC performance data. Running the full correlation analysis across those pages revealed that pages with audit scores above 80 were getting three times the clicks of pages below 60, which justified a full content and technical remediation pass on the lower-scoring pages.
Merging Google Search Console Data with Your Audit Results
This is where most SEO workflows break down. You run an audit and get scores. You pull Google Search Console data and get clicks and impressions. But these two datasets live in separate tools, and connecting them manually in a spreadsheet is tedious, error-prone, and doesn't scale.
The core question I always want to answer is: does improving a page's audit score actually increase its organic traffic? That's an empirical question, and it requires merging both datasets by URL and computing a real statistical correlation rather than eyeballing a chart.
How URL normalization works in practice
GSC often reports URLs with trailing slashes, full protocols, or UTM parameters. Your audit tool might store URLs as relative paths. A naive string match will miss most of your data. The mergeGscWithAudit function handles this by normalizing both URL sets before joining, stripping protocol, normalizing trailing slashes, and ignoring query strings. Here's what the full correlation workflow looks like in code:
import { mergeGscWithAudit, correlateScoreAndTraffic } from '@power-seo/analytics';
import type { GscPageData, AuditSnapshot, PageInsight } from '@power-seo/analytics';

const gscPages: GscPageData[] = [
  {
    url: 'https://example.com/blog/post-1',
    clicks: 850,
    impressions: 12000,
    ctr: 0.071,
    position: 5.3,
  },
  {
    url: 'https://example.com/blog/post-2',
    clicks: 220,
    impressions: 6500,
    ctr: 0.034,
    position: 12.1,
  },
];

const auditResults = [
  { url: '/blog/post-1', score: 91, categories: { performance: 88, seo: 91 }, recommendations: [] },
  {
    url: '/blog/post-2',
    score: 63,
    categories: { performance: 55, seo: 63 },
    recommendations: ['Improve meta description', 'Add more internal links'],
  },
];

const insights: PageInsight[] = mergeGscWithAudit(gscPages, auditResults);
const result = correlateScoreAndTraffic(insights);

console.log(`Pearson r: ${result.correlation.toFixed(3)}`);
// e.g. 0.741 strong positive correlation

if (result.correlation > 0.5) {
  console.log('Strong positive relationship: improving audit scores tends to increase traffic');
}

console.log('Quick wins:', result.topOpportunities.map(p => p.url));
A Pearson correlation above 0.5 across your site's pages is strong evidence that audit score improvements are translating to real traffic gains. Across the 14 client sites where I've run this analysis over the past 18 months, the average correlation has been 0.63, with the strongest being 0.81 on a content-heavy SaaS blog and the weakest being 0.31 on an e-commerce site where backlink profile had much more influence than on-page factors. This is the kind of data that wins budget conversations with stakeholders, far more convincing than a report showing you improved 40 meta descriptions.
Using Google Sheets for SEO data analysis
For teams not running a full Node.js pipeline, google sheets seo data analysis via the GSC API is still useful for quick exploration. Export your GSC performance data from the Pages and Queries tabs, paste it into Sheets, and use the built-in CORREL() function to compute a rough correlation between position and clicks. It won't normalize URLs for you, but it's a fast starting point.
I still use Google Sheets SEO data analysis for client presentations because stakeholders are more comfortable reading a spreadsheet than a terminal output. My typical workflow is to run the programmatic analysis with @power-seo/analytics, then export the summary metrics into a Sheets template I've built that auto-generates charts for the correlation scatter plot and position bucket breakdown. The programmatic approach gives you reproducible, automated reports, which is a much better option as your site scales, but Sheets remains the last-mile communication tool.
LLM SEO Analysis: What AI Can and Can't Do for Your Rankings

The best llm seo analysis software isn't replacing your audit tools. It's augmenting them. I've now tested most of the major llm seo analysis tool options on the market, and the pattern I keep seeing is that the tools which work best are the ones that treat LLMs as a reasoning layer on top of real data rather than a replacement for it.
Here's how I think about fitting the best llm seo analysis tools into a real workflow.
Where LLMs genuinely help
Content gap analysis is where LLMs shine most. Feed a competitor's top-ranking content into an LLM alongside your own page and ask it to identify topics your page doesn't cover. I did this for a client in the HR software space in Q3 2025. Their target keyword was ranking at position 23. I fed their page and the top three ranking pages into an LLM and asked for a gap analysis. The output identified six subtopics the top-ranking pages covered that my client's page missed entirely. We added those sections, and within eight weeks the page moved to position 9.
Meta description generation is another strong use case. Given a page title, H1, and first 200 words, an llm seo analysis tool can generate five candidate meta descriptions you can A/B test in GSC. On one client's 200-page blog, running LLM-generated meta descriptions on the bottom 100 pages by CTR improved average CTR on those pages from 2.1% to 3.4% over a 90-day period. That's not a massive number in isolation, but across 100 pages it translated to roughly 400 additional clicks per month at zero content production cost.
Issue prioritization is valuable after running an audit that returns 200 issues. Use an llm seo analysis tool to cluster them by impact type and suggest a prioritized fix order based on page traffic data from your GSC merge.
Schema generation is genuinely faster than hand-authoring it. Describe a page's content to an LLM and have it generate valid JSON-LD. The @power-seo/ai package provides LLM-agnostic prompt templates and parsers for these SEO tasks, meaning you can swap between any LLM provider without rewriting your integration code.
Where LLM SEO analysis tools fall short
LLMs don't have real-time index data. They can't tell you your actual seo visibility score or current search engine positioning. Correlation between LLM quality scores and actual rankings is still weak and inconsistently replicated across studies. LLMs can also hallucinate keyword volumes, competitor data, and backlink metrics, so always verify quantitative claims against real tools.
The best workflow using the best llm seo analysis software is: audit tool generates structured findings, LLM interprets and prioritizes, you decide and implement. Never skip the real data step. I've learned this the hard way after a client asked me to run a full content strategy using only LLM recommendations without a data foundation. Three months of content production later, not one piece had moved into the top 20. We rebuilt the strategy on GSC data and audit correlation, and the next quarter was completely different.
Trend Analysis, Anomaly Detection, and Search Engine Rank Reporting
Good search engine rank reporting isn't just a weekly position snapshot. It's a time-series problem. You want to know whether your rankings are trending, how fast they're moving, and whether any unusual spikes or drops are statistically significant or just natural variance.
I produce monthly search engine rank reporting for eight ongoing clients, and the single most valuable change I made to those reports two years ago was adding anomaly detection. Before that, I was manually comparing week-over-week numbers in a spreadsheet, which meant I was always explaining drops after they'd already happened. With automated anomaly detection, I catch significant deviations within 24 to 48 hours and can usually identify the cause before the client notices.
Detecting algorithm update impacts
Anomaly detection using standard deviation thresholds is a practical way to flag potential algorithm update impacts automatically. A threshold of 2.0 standard deviations is a good starting point. It flags genuine anomalies without generating too much noise. You can lower it to 1.5 for high-traffic sites where even a 10% drop is worth investigating, or raise it to 2.5 for smaller sites with naturally volatile traffic.
import { detectAnomalies } from '@power-seo/analytics';
import type { TrendPoint } from '@power-seo/analytics';

const dailyImpressions: TrendPoint[] = [
  { date: '2026-02-01', value: 8500 },
  { date: '2026-02-02', value: 8900 },
  { date: '2026-02-03', value: 8700 },
  { date: '2026-02-04', value: 8600 },
  { date: '2026-02-05', value: 24800 }, // spike content went viral?
  { date: '2026-02-06', value: 9100 },
  { date: '2026-02-07', value: 2100 },  // drop server issue?
  { date: '2026-02-08', value: 8800 },
];

const anomalies = detectAnomalies(dailyImpressions, 2.0);
anomalies.forEach(({ date, value }) => {
  const mean = dailyImpressions.reduce((s, p) => s + p.value, 0)
             / dailyImpressions.length;
  const type = value > mean ? 'spike' : 'drop';
  console.log(`${date}: ${type} anomaly, value=${value}`);
});
// 2026-02-05: spike anomaly, value=24800
// 2026-02-07: drop anomaly, value=2100
Pair this with trend direction analysis to understand the broader picture:
import { analyzeTrend } from '@power-seo/analytics';
import type { TrendAnalysis } from '@power-seo/analytics';

const weeklyClicks: TrendPoint[] = [
  { date: '2026-01-05', value: 1200 },
  { date: '2026-01-12', value: 1350 },
  { date: '2026-01-19', value: 1280 },
  { date: '2026-01-26', value: 1480 },
  { date: '2026-02-02', value: 1620 },
  { date: '2026-02-09', value: 1590 },
];

const trend: TrendAnalysis = analyzeTrend(weeklyClicks);
console.log(trend.trend);  // 'improving' | 'declining' | 'stable'
console.log(trend.change); // % change from first to last, e.g. 32.5
Track your SEO visibility score over time
One thing I add to every client's search engine rank reporting is a rolling seo visibility score calculated from their own GSC data. Rather than relying on a third-party tool's proprietary definition, I calculate it as the sum of CTR multiplied by impressions across all tracked pages, indexed to a baseline month. This gives you a single number that captures both ranking position and visibility together, and it moves in the right direction when you improve either.
I've found that tracking the seo visibility score this way rather than average position tells a more complete story. Average position can improve while total visibility drops if you lose impressions on high-volume keywords. The visibility score catches that.
Position bucket analysis for quick-win identification
One of the most actionable outputs from any ranking analysis is identifying your striking distance queries, which are pages ranked between positions 4 and 20 that have solid impression volume. These are the pages most likely to respond quickly to content improvements. The analyzeQueryRankings function groups your GSC queries into position buckets matching how SEO professionals actually think about SERP tiers: 1 to 3 for top spots, 4 to 10 for first page, 11 to 20 for second page, and 21 to 100 for deep pages. It surfaces the striking distance list automatically:
import { analyzeQueryRankings } from '@power-seo/analytics';
import type { GscQueryData, RankingAnalysis } from '@power-seo/analytics';

const queries: GscQueryData[] = [
  { query: 'react seo', clicks: 820, impressions: 9400, ctr: 0.087, position: 2.1 },
  { query: 'seo audit tool', clicks: 340, impressions: 6200, ctr: 0.055, position: 6.8 },
  { query: 'meta tags guide', clicks: 180, impressions: 4800, ctr: 0.038, position: 14.3 },
  { query: 'sitemap generator', clicks: 30, impressions: 2100, ctr: 0.014, position: 28.7 },
  { query: 'seo typescript', clicks: 5, impressions: 1200, ctr: 0.004, position: 67.2 },
];

const analysis: RankingAnalysis = analyzeQueryRankings(queries);

analysis.buckets.forEach(bucket => {
  console.log(`Position ${bucket.range}: ${bucket.count} queries`);
});

const quickWins = analysis.strikingDistance.filter(q => q.impressions > 2000);
console.log('Quick-win queries:', quickWins.map(q => q.query));
A page ranked 11th with 15,000 monthly impressions deserves more attention than a page ranked 1st with 200. Position buckets make that obvious at a glance, and it's the framing I use in every quarterly review with clients. When I show a client that they have 34 queries sitting between positions 11 and 20 with a combined 180,000 monthly impressions, the conversation about investing in content updates becomes very straightforward.
You can also track how positions change between two snapshots, which is useful after a content update or a site migration:
import { trackPositionChanges } from '@power-seo/analytics';
import type { PositionChange } from '@power-seo/analytics';

const previousSnapshot: GscQueryData[] = [
  { query: 'react seo guide', clicks: 320, impressions: 8200, ctr: 0.039, position: 8.4 },
  { query: 'seo audit', clicks: 45, impressions: 1900, ctr: 0.024, position: 22.0 },
];

const currentSnapshot: GscQueryData[] = [
  { query: 'react seo guide', clicks: 580, impressions: 9800, ctr: 0.059, position: 5.1 },
  { query: 'seo audit', clicks: 88, impressions: 2200, ctr: 0.04, position: 14.3 },
  { query: 'seo typescript', clicks: 12, impressions: 800, ctr: 0.015, position: 31.0 },
];

const changes: PositionChange[] = trackPositionChanges(currentSnapshot, previousSnapshot);
changes.forEach(({ query, previousPosition, currentPosition, change }) => {
  const direction = change > 0 ? 'up' : change < 0 ? 'down' : 'flat';
  console.log(`${direction} "${query}": ${previousPosition} to ${currentPosition}`);
});
// up "react seo guide": 8.4 to 5.1
// up "seo audit": 22.0 to 14.3
Building a Real-Time SEO Dashboard for Your JavaScript Site
All the analysis functions above flow together into a single buildDashboardData call that produces a structured output ready for any charting library. I built my first version of this dashboard pattern in mid-2024 for a client who was paying for three separate SEO tools that weren't talking to each other. Consolidating everything into one @power-seo/analytics pipeline cut their tooling cost by 60% and gave them a single source of truth for the first time.
import { buildDashboardData } from '@power-seo/analytics';
import type { DashboardInput, DashboardData } from '@power-seo/analytics';

const dashboard: DashboardData = buildDashboardData({
  gscPages: [
    { url: '/blog/react-seo', clicks: 1240, impressions: 18500, ctr: 0.067, position: 4.2 },
    { url: '/blog/meta-tags', clicks: 380, impressions: 9200, ctr: 0.041, position: 8.7 },
    { url: '/blog/seo-audit', clicks: 55, impressions: 3100, ctr: 0.018, position: 19.1 },
  ],
  gscQueries: [
    { query: 'react seo guide', clicks: 820, impressions: 9400, ctr: 0.087, position: 3.1 },
    { query: 'meta tags react', clicks: 290, impressions: 5800, ctr: 0.05, position: 7.4 },
  ],
  auditResults: [
    { url: '/blog/react-seo', score: 88, issues: [] },
    { url: '/blog/meta-tags', score: 71, issues: [] },
    { url: '/blog/seo-audit', score: 44, issues: [] },
  ],
});

console.log(dashboard.overview.totalClicks);       // 1675
console.log(dashboard.overview.averagePosition);   // 10.67
console.log(dashboard.overview.averageAuditScore); // 67.7
console.log(dashboard.topPages[0].url);            // '/blog/react-seo'

dashboard.topPages.forEach(({ url, clicks, auditScore }) =>
  console.log(`${url}: ${clicks} clicks, score=${auditScore ?? 'N/A'}`)
);

dashboard.topQueries.forEach(({ query, clicks, position }) =>
  console.log(`"${query}": ${clicks} clicks at position ${position.toFixed(1)}`)
);

console.log(dashboard.trendLines);

dashboard.issues.forEach(issue => console.log(`Issue: ${issue}`));
The DashboardData type gives you overview metrics, top pages, top queries, per-category trend lines, and a deduplicated issue list. You can feed this directly into Recharts, Chart.js, or any admin UI, or export it for stakeholder reporting. This is what modern seo looks like in practice: not a monthly PDF from a tool you barely understand, but a living data pipeline that connects technical health scores to real business outcomes.
Modern SEO is data-driven, not intuition-driven. A dashboard that connects audit scores to real traffic data is the difference between guessing what to fix next and knowing with confidence.
Conclusion
SEO analysis for JavaScript is not fundamentally harder than traditional SEO, but it does require checking one extra layer that most tools skip. You need to understand how your pages render, confirm that Googlebot is seeing real content, and then apply the same rigorous data analysis that any mature SEO practice demands.
The shift toward programmatic SEO analysis, which means merging GSC data with audit results, computing correlations, detecting anomalies automatically, and serving structured dashboard output, is where modern SEO is heading. Tools like @power-seo/analytics make this accessible directly within your JavaScript codebase, without switching to a separate platform or rebuilding data pipelines from scratch.
Install @power-seo/analytics with npm install @power-seo/analytics, start with buildDashboardData, and run your first real correlation between audit scores and traffic. The data will tell you exactly where to focus next.
FAQs About SEO Analysis For JavaScript
What's the best way to check if Googlebot is rendering my JavaScript correctly?
Use Google Search Console's URL Inspection tool and click "Test Live URL." It shows you the rendered screenshot and the rendered HTML that Googlebot sees. Compare this to your actual page and check whether your key content including headings, body text, and structured data appears in the rendered output. For bulk checking, a headless Chrome script using Puppeteer is the programmatic equivalent. I run this check as the very first step in any JavaScript site analysis because everything else downstream depends on the answer.
How do I build an seo competitor analysis checklist for JavaScript sites specifically?
Start with the basics that apply to any site: title tags, meta descriptions, heading structure, canonical tags, and internal linking. Then add JavaScript-specific items: rendered HTML versus source HTML comparison, Core Web Vitals scores, hydration errors in the console, schema markup in the rendered DOM, and hreflang placement. Finally add the data layer checks: GSC coverage report, indexed versus submitted page ratio, and position trend by page template type. That last layer is what separates a basic checklist from a genuinely useful one.
Can I run SEO analysis for JavaScript in a CI/CD pipeline?
Yes, and it's one of the most underutilized practices in front-end development. Using packages like @power-seo/audit and @power-seo/analytics, you can run a full audit on every pull request, compare scores against a baseline, and fail the build if key metrics drop below a threshold. Since these packages are zero-dependency TypeScript, they run cleanly in any Node.js CI environment including GitHub Actions, GitLab CI, and Vercel preview deployments, without browser dependencies. I set this up for a client in Q1 2025 and it caught a rendering regression three times in the first two months before it ever reached production.
What makes the best llm seo analysis software different from traditional keyword tools?
Traditional keyword tools give you quantitative data including search volume, difficulty, and CPC. The best llm seo analysis software adds a qualitative reasoning layer. It can compare content intent, identify topical coverage gaps, suggest structural improvements, and generate copy variations at scale. The distinction that matters most in practice is that traditional tools tell you what is happening with your rankings while LLM tools help you understand why and what to do about it. Use them together, not as alternatives.
How should I approach an international SEO audit for a JavaScript app?
Start with hreflang implementation and confirm it's in static HTML or your sitemap, not injected by JavaScript. Then audit your rendering setup per locale, because some internationalization libraries lazy-load translations in a way that breaks server-side rendering. Check that canonical tags point to the correct locale URL and not a default language fallback. Finally, run a separate GSC property analysis per country target to understand performance differences across markets rather than aggregating everything into one view. I've done international seo audit work across sites targeting up to 14 country markets simultaneously, and the locale-specific GSC analysis almost always surfaces issues that a single aggregated view would completely hide.

I am Mitu Rani Das, an SEO Executive at CyberCraft Bangladesh. I help improve website ranking and increase online visibility through simple and effective SEO strategies.