Core Web Vitals SEO Guide for JavaScript Websites (2026)
Mitu Das
super admin

Core Web Vitals SEO Guide for JavaScript Websites is about how your site feels to real people not just how it looks to you while building it. It checks things like how fast the page loads, how quickly buttons respond, and if things jump around while the page is opening. These small things quietly decide if Google will rank your site higher or push it down.
And it makes you wonder why does a site that looks perfect still not get traffic? Why do users leave even when everything seems fine? The truth is, even tiny delays or shifting layouts in React or Next.js can hurt your SEO. Once you understand this, it feels like discovering a hidden reason your hard work wasn’t getting seen.
What Are Core Web Vitals
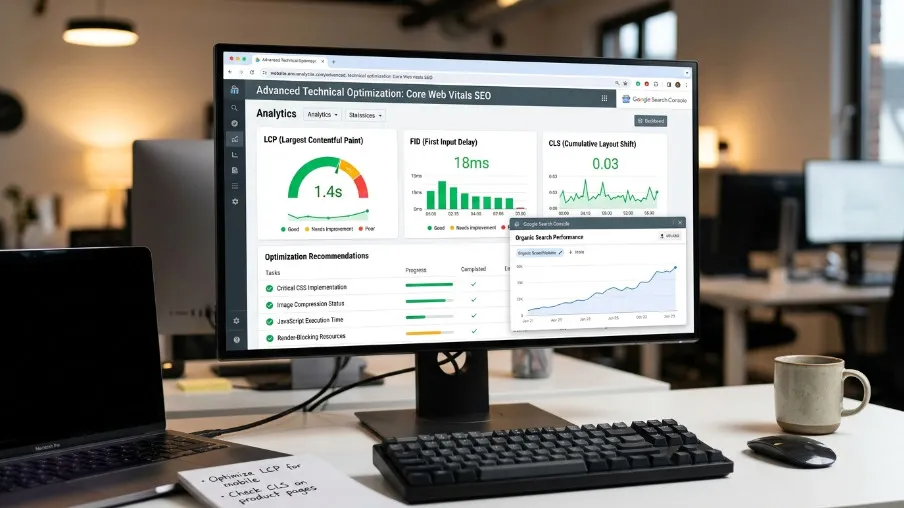
Core Web Vitals are Google’s way of measuring how real users actually experience your website, not just how it looks in a lab test. They focus on three key signals: how fast the main content appears (LCP), how quickly the page reacts when someone interacts with it (INP), and how stable the layout feels while loading (CLS). Together, they answer a simple but important question: does your site feel smooth, fast, and reliable to a real human in the moment?
Core Web Vitals Metrics and Thresholds
When I first looked at Google’s Page Experience rules, I realized it’s not really about perfect performance but about real users on real devices.
| Metric | Good | Needs Improvement | Poor |
| LCP | ≤ 2.5s | 2.5–4.0s | > 4.0s |
| INP | ≤ 200ms | 200–500ms | > 500ms |
| CLS | ≤ 0.1 | 0.1–0.25 | > 0.25 |
What surprised me most is the 75th percentile rule. Google ignores your fastest loads and focuses on what most users actually feel. That changes everything.
And the shift from FID to INP really made me think. It’s no longer just “how fast did the browser react?” but “did the whole interaction feel smooth from tap to screen update?”
Especially in React or Next.js apps, that difference can quietly decide whether users stay or leave without thinking twice.
Do Core Web Vitals Affect SEO Rankings

Yes, Core Web Vitals do affect SEO rankings.
From my perspective, they’re not a magic ranking boost, but they absolutely influence visibility when everything else is equal. If two pages are similarly relevant, the faster, smoother, more stable one tends to win.
What really changed my thinking is this: it’s not about PageSpeed scores. It’s about real users. Google’s Core Web Vitals are based on real-world experience data, not lab tests.
And honestly, I’ve felt it myself, if a page is slow or jumpy, I leave. That behavior sends signals that matter.
So no, Core Web Vitals won’t replace good content. But bad performance can quietly hold even great content back.
Why Core Web Vitals Matter for Business
Core Web Vitals matter for business because they show how real people feel when they use your website. If your site is slow or laggy, people don’t complain; they just leave quietly. That small moment of frustration is often the difference between a sale and a lost user.
I’ve noticed something simple over time: speed builds trust. When a page loads fast and responds instantly, people stay longer, click more, and feel more confident. When it doesn’t, even a good product starts feeling unreliable.
Why Core Web Vitals matter
| Metric | What I notice | What users feel |
| LCP | How fast the page shows content | “Okay, I can see it. I’ll stay.” |
| INP | How fast clicks respond | “This feels smooth.” or “Why is it stuck?” |
| CLS | Whether things move around | “I didn’t click that… annoying!” |
A real moment I remember
I worked on a SaaS pricing page that felt a bit slow. The INP was around 480ms. It wasn’t broken, but it felt slightly “sticky,” especially when users hovered tooltips or changed plans.
I started wondering, what if users are dropping off here without telling us?
So I made a few small changes:
- I reduced heavy event handling
- I delayed non-important scripts
- I lazy-loaded tooltip features
The difference was clear. INP dropped to 160ms. And over the next 3 months:
- More people started coming from search (+23%)
- More people actually signed up (+11%)
How to Test Core Web Vitals Properly
I test Core Web Vitals by using lab tools to find issues first, then check field data to see if real users actually experienced improvement. I focus on high-traffic pages, prioritize mobile performance, and run tests multiple times instead of trusting a single result.
Use lab data to identify issues in controlled conditions, and field data to confirm real-world performance with actual users.
| Type | Meaning |
| Lab data | I test in controlled conditions to spot issues |
| Field data | I verify results using real user data |
| Mistake 1 | I don’t just test the homepage |
| Mistake 2 | I include mobile users, not just desktop |
| Mistake 3 | I don’t rely on only one test result |
Common Core Web Vitals Issues and Causes
Slow LCP usually comes from hero images that are not preloaded or served in the wrong format, server response time above 600ms, render-blocking CSS or JavaScript in the head of the document, or client-side rendering making the browser wait for JavaScript before showing any content.
High INP is the critical one for JavaScript frameworks in 2026. The most common causes are long JavaScript tasks blocking the main thread, synchronous event handlers doing too much computation, large React component trees re-rendering unnecessarily on every interaction, third-party scripts competing for main-thread time, and React hydration blocking interactivity during the initial page load.
CLS problems typically come from images without explicit width and height attributes, dynamically injected content pushing existing content down after load, web fonts causing text reflow, and CSS animations using properties that trigger layout recalculation.
How to Improve Core Web Vitals
I open Google Search Console, head straight to Core Web Vitals → Poor URLs. These are the real targets behind most SEO mistakes. LCP first, then INP, then CLS. Curious what’s actually breaking the experience.
Improve LCP
Preload your hero image so the browser discovers it immediately:
<link rel="preload" as="image" href="/hero.webp" fetchpriority="high" />


<img
  src="/hero.webp"
  alt="Product hero"
  width="1200"
  height="630"
  fetchpriority="high"
  loading="eager"
/>
If you're using @power-seo/images in your build pipeline, its auditLazyLoading() function automatically catches above-fold images incorrectly marked as lazy, which is one of the most common LCP killers in JavaScript sites:
import { auditLazyLoading } from '@power-seo/images';

const result = auditLazyLoading([
  { src: '/hero.webp', loading: 'lazy', isAboveFold: true, width: 1200, height: 630 },
]);
// Returns: issue type 'lazy-above-fold' with severity 'error'


You can run a full image audit combining all analyzers on a single page:
import { analyzeAltText, auditLazyLoading, analyzeImageFormats } from '@power-seo/images';


const images = [
  { src: '/hero.jpg', alt: '', loading: 'lazy', isAboveFold: true, width: 1200, height: 630 },
  { src: '/product.webp', alt: 'Blue widget', loading: 'lazy', isAboveFold: false, width: 400, height: 400 },
];


const altResult = analyzeAltText(images, 'blue widget');
const lazyResult = auditLazyLoading(images);
const formatResult = analyzeImageFormats(images);


console.log(`Alt text issues: ${altResult.issueCount}/${altResult.totalImages}`);
console.log(`Lazy loading issues: ${lazyResult.issues.length}`);
console.log(`Legacy formats: ${formatResult.legacyFormatCount}/${formatResult.totalImages}`);
Address TTFB at the server level. If your server takes more than 600ms to respond, no frontend optimization will get you to Good LCP. Use a CDN, enable server-side caching, or move to edge rendering.
Improve INP
The mental model for INP: every user interaction opens a roughly 50ms window. Your JavaScript must finish processing and the browser must paint the update within that window.
Break up long tasks using scheduler.yield():
async function handleComplexClick() {
  updateButtonState();


  // Yield and let the browser paint before continuing
  await scheduler.yield();


  await processHeavyOperation();
}


Debounce event handlers that fire repeatedly:
function debounce(fn, delay) {
  let timeout;
  return (...args) => {
    clearTimeout(timeout);
    timeout = setTimeout(() => fn(...args), delay);
  };
}


const handleSearch = debounce((query) => {
  fetchSearchResults(query);
}, 200);


Improve CLS
Give every image explicit dimensions so the browser reserves the right space before the image loads:
<img src="/product.jpg" alt="Product" width="800" height="600" />


Reserve space for dynamic content such as ads and banners that load asynchronously:
.ad-container {
  min-height: 90px;
}


.image-wrapper {
  aspect-ratio: 16 / 9;
}


Preload critical web fonts and use font-display: swap:
<link rel="preload" as="font" href="/fonts/inter.woff2" crossorigin />
Mobile-First Core Web Vitals SEO Optimization
I can’t help noticing how misleading “fast” can be when shifting from desktop to mobile. A page that passes at 180ms INP can quietly fall apart on a mid-range Android device, jumping to 600ms just because mobile CPUs struggle with JavaScript. That gap makes me question what users are actually experiencing in real life.
With Google's Core Web Vitals, it becomes clear why details like INP matter so much. Real responsiveness isn’t just about lab scores. Even basic UX choices like 48x48px touch targets can decide whether a tap feels smooth or annoying. And techniques like content-visibility: auto feel almost underrated; skipping off-screen rendering can completely change how heavy a long page feels.
Advanced Technical Optimization
I keep coming back to the same idea: before anything else, run a core web vitals test and really look at INP, because that’s where real user frustration shows up first. A good core web vitals tester or core web vitals checker will immediately point out if JavaScript bloat or hydration is slowing down interaction.
From there, the fix usually becomes obvious: ship less JS, because every extra kilobyte competes on the main thread during parsing and execution. In React and Next.js apps, hydration is often the silent performance killer, and moving toward progressive hydration or an Islands Architecture can completely change the first-load experience.
Static assets belong on a CDN with long-term caching like Cache-Control: public, max-age=31536000, immutable, so repeat visits feel instant. And when edge tools like Cloudflare Workers or Vercel Edge Functions cut TTFB from ~800ms to under 100ms globally, the product starts to feel almost immediate, like it’s reacting before the user even thinks.
Framework-Specific Optimization
React
Start by profiling before touching any optimization. Open Chrome DevTools, go to the Performance tab, and record while interacting with the page to understand what’s happening under the hood.
Long “Scripting” bars are usually the first clue. They often reveal which components are blocking the main thread.
Fixes tend to be straightforward: wrap stable components in React.memo(), move heavy calculations into useMemo(), keep callbacks stable with useCallback(), and split large below-the-fold sections using React.lazy() with Suspense.
I usually find it satisfying watching a slow UI turn smooth just by following what the profiler is already showing.
Next.js
Use the <Image> component for all images. It handles lazy loading, proper sizing, and format conversion automatically:
import Image from 'next/image';


// Above-fold hero, preloaded and eager
<Image
  src="/hero.webp"
  alt="Hero image"
  width={1200}
  height={630}
  priority
/>


// Below-fold, lazy loaded by default
<Image
  src="/section.webp"
  alt="Section image"
  width={800}
  height={400}
/>


Use next/font for zero-CLS font loading:
import { Inter } from 'next/font/google';
const inter = Inter({ subsets: ['latin'], display: 'swap' });


Use next/dynamic with ssr: false for heavy client-only components such as charts, maps, and rich text editors. Always reserve their space to prevent CLS:
import dynamic from 'next/dynamic';


const HeavyChart = dynamic(() => import('./HeavyChart'), {
  ssr: false,
  loading: () => <div style={{ height: '400px' }} />,
});
Prefer Server Components for anything without client-side interactivity. Every 'use client' directive adds to your hydration budget and increases the risk of poor INP on initial load.
Managing Meta Tags
While working on Core Web Vitals, I realized how much smoother everything feels when the meta infrastructure is solid. With Next.js App Router and @power-seo/meta, it quietly generates perfectly structured server-side meta tags from one unified config and it honestly makes me wonder why I didn’t set this up sooner.
import { createMetadata } from '@power-seo/meta';


export const metadata = createMetadata({
  title: 'My Page',
  description: 'A page about something great.',
  canonical: 'https://example.com/my-page',
  robots: { index: true, follow: true, maxSnippet: 150 },
  openGraph: { type: 'website', images: [{ url: 'https://example.com/og.jpg' }] },
});


For Remix v2:
import { createMetaDescriptors } from '@power-seo/meta';


export const meta = () =>
  createMetaDescriptors({
    title: 'My Page',
    description: 'A page about something great.',
    canonical: 'https://example.com/my-page',
  });
Catching Regressions with SEO Audits
Ever tried plugging programmatic SEO auditing straight into your deployment pipeline? It’s kind of a game changer for a JavaScript SEO Audit workflow.
@power-seo/audit gives a clean 0–100 score across meta tags, content quality, structure, and performance rules, and it quietly exposes what usually gets missed.
Feels almost like catching SEO bugs before they ever reach production—and that’s the part that keeps me curious every time I run it.
import { auditPage } from '@power-seo/audit';


const result = auditPage({
  url: 'https://example.com/blog/react-seo-guide',
  title: 'React SEO Guide — Best Practices for 2026',
  metaDescription: 'Learn how to optimize React applications for search engines.',
  canonical: 'https://example.com/blog/react-seo-guide',
  robots: 'index, follow',
  content: '<h1>React SEO Guide</h1><p>Search engine optimization for React apps...</p>',
  headings: ['h1:React SEO Guide', 'h2:Why SEO Matters for React'],
  images: [{ src: '/hero.webp', alt: 'React SEO guide illustration' }],
  internalLinks: ['/blog', '/docs/meta-tags'],
  focusKeyphrase: 'react seo',
  wordCount: 1850,
});


console.log(result.score); // e.g. 84
For CI pipelines, you can fail the build when scores fall below a threshold:
import { auditSite } from '@power-seo/audit';


const report = auditSite({ pages });


const SCORE_THRESHOLD = 75;
const totalErrors = report.pageResults
  .flatMap((p) => p.rules.filter((r) => r.severity === 'error'))
  .length;


if (report.score < SCORE_THRESHOLD || totalErrors > 0) {
  console.error(`SEO audit FAILED — average score: ${report.score}`);
  process.exit(1);
}


console.log(`SEO audit PASSED — average score: ${report.score}/100`);


You can also run individual rule sets if you only need to check specific areas:
import { runPerformanceRules } from '@power-seo/audit';


const perfRules = runPerformanceRules(input);
const errors = perfRules.filter((r) => r.severity === 'error');
console.log(`Performance errors: ${errors.length}`);
Connecting Core Web Vitals to Traffic Data
I fixed vitals, and the first thing I wanted to know was: did it actually move the needle? @power-seo/analytics lets you merge Google Search Console data with audit results and see the real story through Pearson correlation between scores and clicks; finally, signal over guesswork.
import { mergeGscWithAudit, correlateScoreAndTraffic, buildDashboardData } from '@power-seo/analytics';


const insights = mergeGscWithAudit(gscPages, auditResults);
const result = correlateScoreAndTraffic(insights);


console.log(`Pearson r: ${result.correlation.toFixed(3)}`);
// e.g. 0.741 — strong positive correlation


console.log('Quick wins:', result.topOpportunities.map((p) => p.url));
You can also track position changes before and after your Core Web Vitals fixes:
import { trackPositionChanges } from '@power-seo/analytics';


const changes = trackPositionChanges(currentSnapshot, previousSnapshot);
changes.forEach(({ query, previousPosition, currentPosition, change }) => {
  const direction = change > 0 ? '↑' : change < 0 ? '↓' : '→';
  console.log(`${direction} "${query}": ${previousPosition} → ${currentPosition}`);
});


And detect traffic anomalies, such as drops caused by regressions after a deployment:
import { detectAnomalies } from '@power-seo/analytics';


const anomalies = detectAnomalies(dailyImpressions, 2.0);
anomalies.forEach(({ date, value }) => {
  console.log(`Anomaly on ${date}: value=${value}`);
});
Industry-Specific Strategies
I’ve found that performance improves massively when i stop treating third-party scripts like they deserve instant priority.
For e-commerce, use a facade pattern around payment widgets and live chat tools. Instead of loading them immediately, show a clean static placeholder that feels like the real widget. The actual script only kicks in on click or hover. It’s surprising how much this alone reduces main-thread blocking.
In SaaS dashboards, my focus is simple: get the main data table visible first. That’s what users came for. Charts and side panels can wait. Skeleton screens help a lot when they match the final layout exactly: no layout jumps, no confusion, just calm loading.
For content-heavy blogs, ads are usually the silent performance killer. So lazy-load anything below the fold, wrap ad slots in fixed min-height containers, and keep a close eye on which ad scripts are really necessary. Less chaos, faster pages.
It’s not about doing everything at once; it’s about letting the user see what matters first, and everything else can earn its place afterward.
Continuous Monitoring and Tracking
Lab tests give me a snapshot. Real user monitoring gives continuous reality. The Web Vitals library reports actual Core Web Vitals from users as they browse:
import { onLCP, onINP, onCLS } from 'web-vitals';


function sendToAnalytics({ name, value, rating }) {
  console.log(`${name}: ${value} (${rating})`);
  // Send to your analytics endpoint or GA4
}


onLCP(sendToAnalytics);
onINP(sendToAnalytics);
onCLS(sendToAnalytics);
Segment this data by device type, page template, and geographic region. Mobile users in South and Southeast Asia on mid-range Android devices often experience 3 to 5 times worse INP than desktop users in North America.
You can also pull this data directly from Google Search Console using @power-seo/search-console to automate your monitoring workflow:
import { createTokenManager, createGSCClient, querySearchAnalyticsAll, exchangeRefreshToken } from '@power-seo/search-console';


const tokenManager = createTokenManager(() =>
  exchangeRefreshToken({
    clientId: process.env.GSC_CLIENT_ID!,
    clientSecret: process.env.GSC_CLIENT_SECRET!,
    refreshToken: process.env.GSC_REFRESH_TOKEN!,
  }),
);


const client = createGSCClient({
  siteUrl: 'https://example.com',
  auth: tokenManager,
});


const rows = await querySearchAnalyticsAll(client, {
  startDate: '2026-01-01',
  endDate: '2026-01-31',
  dimensions: ['query', 'page'],
});


rows.forEach(({ keys, clicks, impressions, position }) => {
  console.log(`Query: "${keys[0]}", Page: ${keys[1]}`);
  console.log(`  ${clicks} clicks, ${impressions} impressions, pos ${position.toFixed(1)}`);
});
Integrate Lighthouse CI into your GitHub Actions workflow so every pull request gets an automatic performance gate:
# .github/workflows/lighthouse.yml
- name: Run Lighthouse CI
  run: lhci autorun
  env:
    LHCI_GITHUB_APP_TOKEN: ${{ secrets.LHCI_GITHUB_APP_TOKEN }}
A regression that ships to production can take 4 to 8 weeks to appear in your Search Console data. Catch it in CI before it costs you ranking positions.
Build a consistent optimization workflow into your regular process. Every deploy should run Lighthouse CI automatically and fail on regressions before they reach users. Weekly, review Search Console for new Poor URLs. Monthly, analyze real user monitoring data segmented by device type and page template. Quarterly, conduct a full audit of third-party scripts against their actual business value.
Making Sure Your Analytics Are GDPR-Compliant
I’ve noticed something important while setting up monitoring, analytics scripts should only run after consent, otherwise it feels like crossing a line with users’ trust. Using @power-seo/tracking helps me handle that properly.
import { createConsentManager, buildGA4Script } from '@power-seo/tracking';
const consent = createConsentManager({
  necessary: true,
  analytics: false,
  marketing: false,
});

const scripts = buildGA4Script({ measurementId: 'G-XXXXXXX' });
// Only load scripts where consent matches
const toLoad = scripts.filter((s) => s.shouldLoad(consent.getState()));
// toLoad → [] until analytics consent is granted

// After user clicks "Accept All"
consent.grantAll();
const nowLoad = scripts.filter((s) => s.shouldLoad(consent.getState()));
// nowLoad → [GA4Script1, GA4Script2]
Core Web Vitals SEO Checklist
I focus on speed, stability, and real-user performance.
Hero images are preloaded with fetchpriority="high" and always include explicit width and height to prevent layout shift. Above-the-fold images load eagerly, while fonts are preloaded with font-display: swap so text appears instantly.
JavaScript is route-split so no bundle exceeds ~150KB gzipped. Long tasks are broken into smaller chunks using scheduler.yield(), and synchronous third-party scripts are avoided in the <head>. Static assets are served via a CDN with long-term caching (immutable), and layout space is reserved in advance to eliminate content jumps.
UX standards keep touch targets at 48x48px, ensure smooth loading on slow networks, and prevent layout shifts from overlays or ads.
Monitoring relies on web-vitals for real-user data. Every release runs through Lighthouse CI, alongside regular Core Web Vitals testing. A Core Web Vitals checker workflow is used to track regressions, and a Core Web Vitals tester setup validates changes in pull requests before merge. Weekly reviews are aligned with Search Console Core Web Vitals reports, with alerts for spikes in poor-performing URLs.
Conclusion
Core Web Vitals are no longer optional. For React and Next.js sites, INP is your biggest gap in 2026: fix it and rankings follow.
Your action plan is simple: audit Search Console for Poor URLs, run PageSpeed Insights to find causes, then fix LCP first, INP second, CLS third. Install web-vitals today to track real users, not lab simulations. Add Lighthouse CI so regressions never reach production.
The sites outranking you haven't just written better content. They've built a faster foundation. Now you have the roadmap. Start today.
FAQs About Core Web Vitals SEO
Will fixing Core Web Vitals guarantee a rankings boost?
No, but it removes a negative ranking factor and can improve user engagement signals that support better performance over time.
How long does it take for Core Web Vitals fixes to show in rankings?
Usually 4–8 weeks for search impact, since Google uses a 28-day rolling data window for evaluation.
Does Core Web Vitals affect mobile and desktop rankings separately?
Yes, Google evaluates them separately, and mobile performance matters more due to mobile-first indexing.
What's the single fastest fix I can make today?
Add width and height attributes to images to reduce layout shift and quickly improve CLS.


FAQ
Frequently Asked Questions
We offer end-to-end digital solutions including website design & development, UI/UX design, SEO, custom ERP systems, graphics & brand identity, and digital marketing.
Timelines vary by project scope. A standard website typically takes 3-6 weeks, while complex ERP or web application projects may take 2-5 months.
Yes - we offer ongoing support and maintenance packages for all projects. Our team is available to handle updates, bug fixes, performance monitoring, and feature additions.
Absolutely. Visit our Works section to browse our portfolio of completed projects across various industries and service categories.
Simply reach out via our contact form or call us directly. We will schedule a free consultation to understand your needs and provide a tailored proposal.